Reassembling Postgres from the wire
tapgres taps a local PostgreSQL connection and decodes its traffic into something you can read. It is Ning Sun’s project, and he also maintains the pgwire crate it decodes with, which is to say the protocol expertise underneath it is his. I am a contributor. My commits are the connection metrics and traffic rates, a display filter language, session save and replay, and a pass hardening the reassembly, proxy and decoder paths.
I want to write about the part that surprised me, which is not the protocol. It is what changes about decoding a protocol when you are watching it rather than participating in it.
An endpoint has advantages you never think about
When your application talks to Postgres, an enormous amount is handled before your code sees a byte. The kernel’s TCP stack gives you an ordered, gapless stream. Retransmissions and reordering are resolved beneath you. You know when the conversation started, because you started it. If a segment goes missing, the other side sends it again, because the protocol is built on the assumption that both ends want the conversation to succeed.
A passive observer has none of that.
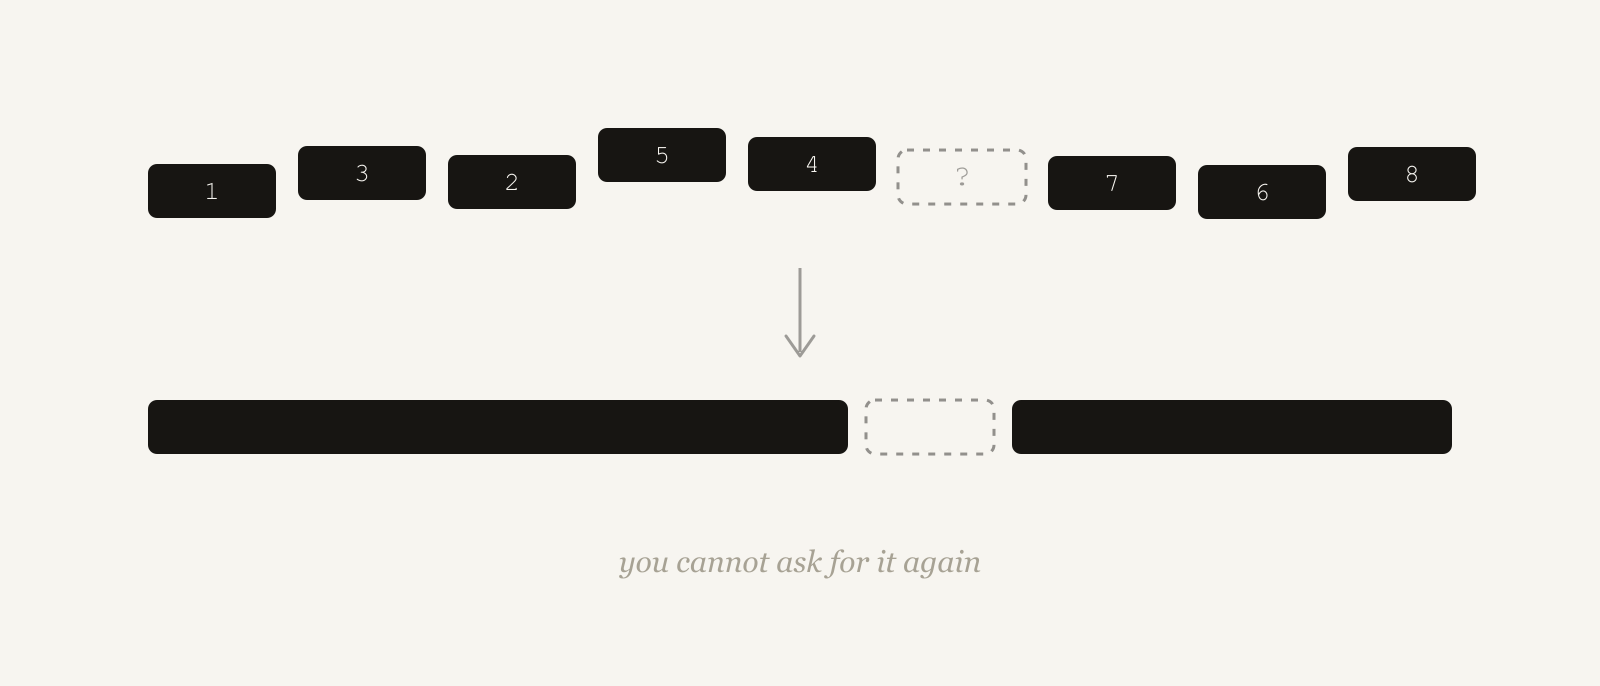
You get individual packets from libpcap, possibly reordered, possibly duplicated, possibly missing entirely because the kernel dropped them under load before you ever saw them. You might have started capturing halfway through a connection that has been open for hours. You cannot ask for anything to be sent again, because as far as both real endpoints are concerned you do not exist.
So you end up reimplementing a chunk of TCP in userspace, with worse information and no ability to apply backpressure. That constraint shapes every decision in the code.
Deciding when a hole is permanent
Reassembly is tracked per connection, keyed by the 4-tuple, normalised so both directions collapse to one entry, with each direction reassembled independently before its bytes are fed to the message decoder. That part is mechanical.
The interesting question is what to do when a segment does not arrive.
An endpoint waits, because waiting works: the peer will retransmit. An observer that waits forever stalls that direction and buffers out-of-order bytes until it runs out of memory. So there is a cap on how many out-of-order bytes a direction will hold, and the reasoning behind it is the one I keep coming back to. Normal reordering resolves within a handful of segments. If you have buffered well past that, the missing segment is not late, it is gone: the kernel dropped it before the capture saw it, and no amount of patience will produce it.
At that point the correct behaviour is to resync past the hole rather than stall. You will lose some messages. You will emit a gap. What you will not do is silently grow forever, and you will not pretend the stream is contiguous when it is not.
That is a general property of observer tools that took me a while to internalise. Every unbounded buffer is a bet that the thing you are waiting for will eventually arrive. An endpoint can make that bet. An observer cannot.
Phantom connections
There is a subtler failure. When a connection closes, you cannot immediately forget it, because trailing close-handshake packets and retransmits are still in flight. If you drop the entry the instant you see a FIN, those stragglers arrive against an unknown 4-tuple and you helpfully invent a brand new connection consisting of nothing but the death rattle of the old one. Your connection count drifts upward and your output fills with sessions that never existed.
So closed connections are retained for a grace period, measured in subsequent activity rather than wall-clock time, then swept.
And because you cannot rely on ever seeing a clean close, there is a hard cap on retained connections as a backstop. Clients crash. Captures start late and miss the handshake entirely. NAT rebinds reuse a 4-tuple for something unrelated. Any of those leave you holding state for a conversation that will never conclude, and the tool has to stay bounded through all of it.
The pattern across all of this: memory limits are not tuning, they are correctness. A monitoring tool that can be killed by the traffic it monitors is worse than no monitoring tool.
The decoder has to be a state machine
Here is where the protocol gets genuinely interesting, and where naive decoding falls apart.
In the simple query protocol, a Query message carries its SQL text, so decoding is self-contained: you see the message, you know the query. Almost nothing uses it. Drivers and ORMs use the extended protocol, where the work is split across messages:
Parsecarries the SQL and gives it a statement name.Bindreferences that statement by name, supplies parameters, and produces a named portal.Executereferences the portal.
Notice what that means for an observer. Execute contains no SQL. Neither does Bind. If you decode messages in isolation, the most important event in the entire conversation, the moment a query actually runs, renders as an opaque reference to a name.
So the decoder keeps per-direction state: a map from statement name to SQL learned from Parse, and a map from portal name to statement name learned from Bind. When Execute arrives, it resolves the portal to a statement and the statement to the text, and prints the query that is actually running. That is the resolution I added, and it is the difference between a decoder that shows you protocol mechanics and one that shows you what your database is doing.
That map is capped, for the reason everything here is capped: a connection that prepares statements and never closes them would otherwise grow the cache indefinitely.
There is also an honest failure mode worth stating plainly. If capture started after the Parse, the name will never resolve, because the information was never on the wire while you were listening. The right output there is an unresolved name, not a guess. A decoder that invents plausible SQL is worse than one that admits it arrived late.
A filter language that has to be cheap
Once decoding works, the problem becomes volume. A busy connection produces far more messages than you can read, so you need to filter, and filtering is where I spent most of my time.
The language is a deliberately small, typed subset of Wireshark’s display filters over five fields: client.ip, client.port, message.direction, message.type and message.text. It supports equality, set membership, substring contains, regex matches, boolean operators and parentheses:
message.type in {"Query", "DataRow"} and message.text contains "orders"
not (message.direction == "b2f" or message.type matches r"^Error")
client.port >= 40000 and client.port < 50000
Two design decisions are worth pulling out.
The first is that ordered comparisons are restricted to the one numeric field. You can write client.port >= 40000, and you cannot write message.type > "Query", because that expression has no meaning and a language that accepts meaningless expressions will eventually be asked what they mean. It is a small typed language rather than string soup, and rejecting nonsense at parse time is cheaper than explaining it later.
The second is where the work happens. Parsing the expression and compiling its regexes happen once, when the filter is set. Evaluating a message against the compiled filter performs no allocation. That is not premature optimisation: this runs per message, on live traffic, inside a tool whose entire value proposition is not falling behind the thing it is watching. An allocating filter turns a diagnostic tool into a source of drops.
The same expressions work in the TUI and in stdout, which matters more than it sounds. The filter you refine interactively while hunting something is the filter you paste into a script afterwards.
Capture once, replay forever
The other piece I contributed is session save and replay: write decoded records to disk, then reopen them later with no live capture at all.
This converts a debugging session from something you have to reproduce into an artefact you can share. Protocol bugs are often intermittent and environment-specific, and “run this and try to make it happen again” is a bad instruction. A saved session is a fixture. It is also, conveniently, the thing you want in a test.
What you actually learn
The thing worth doing, if you work near a database, is watching your own application through something like this for an hour.
You discover that the driver you thought was running one query is preparing an unnamed statement, describing it to learn the result shape, binding with a mix of text and binary formats, executing, and syncing. You see the same statement prepared again on a different connection, because prepared statements are per-connection state. You see how much of the conversation is the client asking the server to describe itself.
None of that is hidden. It is all in the protocol documentation. But reading a specification tells you what is permitted, and watching the wire tells you what your particular stack actually does, which is a much smaller and much more surprising set.
No account, no tracking. One vote per reader.